
A dashboard can look healthy while the acquisition engine is quietly losing money. Spend is up, clicks are cheap, and platform-reported conversions are climbing. But if new customers are lower quality, conversion lag is being ignored, or creative fatigue is masking itself behind blended averages, the account is not scaling. It is accumulating risk.
The best paid media reporting metrics do more than document activity. They tell an operator where to allocate the next dollar, which ads deserve more reach, which campaigns are wasting budget, and whether growth is actually profitable. That requires a reporting system built for decisions, not a weekly slideshow built to make performance look tidy.
Start With the Business Outcome, Not the Platform View
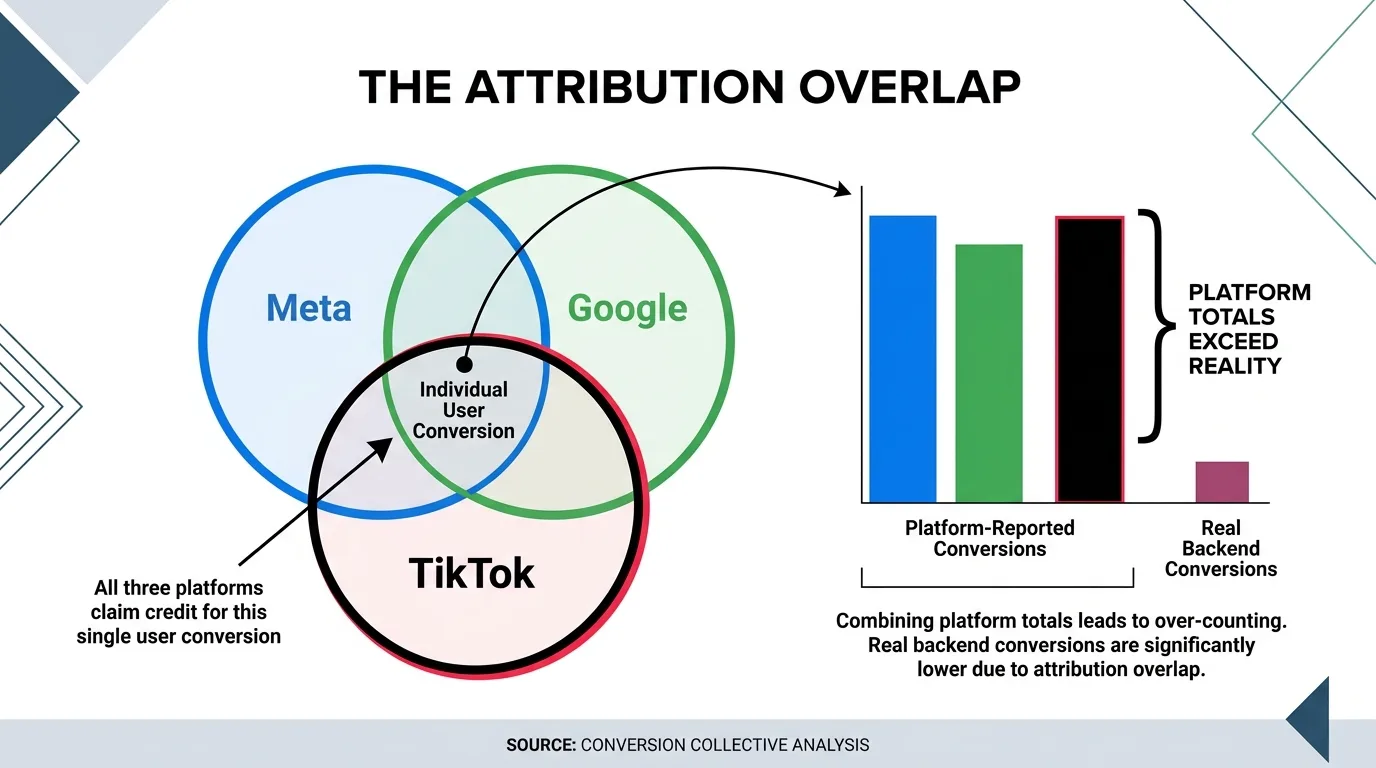
Every platform has a default set of metrics designed to prove its value: impressions, clicks, conversions, and reported return on ad spend. They are useful diagnostic inputs, but they are not the operating truth. Meta, Google, TikTok, and native platforms each use different attribution rules, conversion windows, and optimization models. Treating their dashboards as a single source of truth creates false confidence.
The reporting hierarchy should start with the commercial event that matters most. For ecommerce, that may be contribution-margin-adjusted new customer revenue. For lead generation, it may be qualified leads, issued policies, funded loans, or sales-accepted opportunities. For apps, it may be retained users or subscribers. For publishers, it may be engaged subscribers or downstream revenue per acquisition.
Once that outcome is clear, work backward. The job of paid media reporting is to connect spend, creative, audience, and channel decisions to that outcome quickly enough to act before waste compounds.
The Best Paid Media Reporting Metrics for Decisions
No single metric can run a paid acquisition program. A disciplined reporting system combines business-level efficiency metrics with leading indicators that explain why performance is moving.
Key Decision-Making Metrics Comparison
| Metric | Primary Focus | Best Used For | Key Limitation |
|---|---|---|---|
| Blended CAC | Overall acquisition efficiency | Checking cross-channel budget balance | Masks performance of individual campaigns |
| Contribution Margin | Net profitability | Protecting margins against variable costs | Hard to measure with delayed cost data |
| New Customer ROAS | Direct demand generation | Scaling prospecting campaigns | Ignores downstream customer lifetime value |
| Qualified Conversion Rate | Quality of acquired leads | Feedback loop for B2B/lead gen targeting | Requires deep CRM integration and tracking |
1. Blended CAC or CPA
Blended customer acquisition cost is the most useful top-line control metric for many growth teams. It compares total paid media spend with total new customers or qualified acquisitions over the same period. Unlike a platform-reported CPA, it is less vulnerable to attribution overlap and self-reported conversion credit.
Blended CAC is especially valuable when multiple channels touch the same customer journey. A prospect may see a TikTok video, search the brand later, and convert through branded Google search. Channel dashboards will compete for credit. Blended CAC keeps the team accountable to the cost of acquiring the customer, not the story each platform tells about itself.
It does have limits. It can hide which channel or creative is driving the change. Use it as the scorecard, then use channel-level reporting to diagnose the cause.
2. Contribution Margin After Ad Spend
Revenue-based ROAS can mislead teams with thin margins, high shipping costs, discounts, returns, or meaningful fulfillment expenses. A campaign that produces a 2.5x ROAS may look acceptable on a platform dashboard and still destroy profit.
Contribution margin after ad spend puts the right economics in view. It accounts for the revenue left after variable costs, then subtracts media cost. For businesses with recurring revenue, this can be paired with predicted lifetime value, but the forecast must be grounded in real cohort behavior rather than optimistic assumptions.
If profit data is delayed, report both a near-term proxy and the later confirmed result. Fast optimization matters, but it should not come at the expense of economic reality.
3. New Customer Revenue and New Customer ROAS
Repeat purchasers are valuable, but they can inflate acquisition performance. Retargeting campaigns often claim strong ROAS by converting people who were already likely to buy. That is not necessarily bad. Retargeting has a role. But it should not be confused with new demand generation.
New customer revenue and new customer ROAS separate acquisition from harvest. They show whether prospecting media is bringing incremental buyers into the business and whether the cost of doing so remains acceptable. For subscription and app businesses, use new paid subscribers or retained new users instead of raw sign-ups when possible.
4. Qualified Conversion Rate
The cheapest conversion is rarely the best conversion. In lead generation, a low cost per lead often signals broad targeting, weak forms, or incentives that attract people with no intent to buy. The right question is not how many leads arrived. It is how many became commercially valuable.
Report the progression from lead to qualified lead, sales opportunity, and closed revenue. If the sales cycle is long, use the earliest qualification event with a proven relationship to eventual revenue. This gives media buyers a faster feedback loop without rewarding low-quality volume.
5. Incrementality and Lift Signals
Attribution is directional, not definitive. When spend increases, platform conversions may rise because the platform received more credit, not because the business generated more demand. Incrementality reporting tests whether paid activity created outcomes that would not have happened otherwise.
The strongest methods include geographic holdouts, audience splits, conversion lift studies, and controlled budget tests. These are not always available weekly, and they require careful setup. Still, periodic incrementality checks are essential for validating large spend decisions, especially in branded search, retargeting, and high-frequency social campaigns.
Use them to challenge assumptions, not to chase false precision. A well-designed test that shows directionally credible lift is more useful than a complicated model no one trusts.
Metrics That Explain Performance Movement
Outcome metrics tell you whether the program is working. Diagnostic metrics tell you where to intervene. The most useful reporting views break these metrics out by channel, campaign type, audience, placement, landing page, and creative concept.
Creative is often the fastest path to improvement, so creative-level reporting deserves more than a thumbnail gallery and spend total. Track thumb-stop rate or early video engagement, click-through rate, landing page view rate, conversion rate, cost per acquisition, and spend concentration by asset. The exact engagement metric varies by platform, but the operating question stays the same: is the ad earning attention, generating qualified traffic, and converting that traffic efficiently?
Frequency should be monitored alongside creative performance. Rising frequency is not automatically a problem. A high-intent retargeting audience can tolerate more exposure than a broad prospecting audience. But when frequency rises while click-through rate, conversion rate, or marginal CPA deteriorates, the team likely needs fresh creative, a broader audience, or a budget shift.
Landing page conversion rate is another critical diagnostic. If click-through rate is strong but CPA rises, media is not always the culprit. The offer, page speed, checkout flow, form length, or message match may be creating the bottleneck. Good reporting prevents teams from endlessly changing targeting when the post-click experience is the real constraint.
Report by Cohort, Not Just by Calendar Week
Calendar-week performance can create bad decisions when conversion lag is material. A campaign launched on Monday may generate leads immediately, while qualified customers arrive two or three weeks later. Judging it against mature campaigns in the same weekly report penalizes the program before it has time to prove itself.
Cohort reporting groups customers by acquisition date and tracks their quality over time. For ecommerce, that may mean refund rates, second-purchase rates, and contribution margin by first-order cohort. For subscriptions, it means trial-to-paid conversion, month-one retention, and churn by source and creative. For lead generation, it means contact rate, qualification, and revenue realization.
This is where reporting becomes a growth system rather than a media recap. It connects short-term optimization decisions with the downstream quality of the customers being acquired.
Build a Decision Cadence, Not a Reporting Ceremony
Daily reporting should surface spend pacing, delivery issues, major CPA movement, and broken tracking. It is for protecting the account and reacting to clear signals. Daily optimization based on small conversion counts, however, creates noise and churn.
Weekly reporting is where teams should review creative winners and losers, audience saturation, budget reallocation, landing page constraints, and channel-level efficiency. The output should be explicit actions: scale these ads, pause these campaigns, refresh these concepts, validate this tracking gap, or test this offer.
Monthly reporting should step back further. Review blended efficiency, customer quality, profit contribution, incrementality findings, and whether spend is moving toward the channels and creative systems that can scale. This is the right forum for changing targets, reallocating meaningful budget, and deciding what operational capacity the next stage of growth requires.
At Conversion Collective, the goal is not more reporting artifacts. It is a unified view that lets creative production, media buying, and optimization move from signal to action without delay.
Avoid the Metrics That Make Accounts Look Better Than They Are
Vanity metrics are not useless, but they become dangerous when they are treated as outcomes. Impressions, reach, cheap clicks, video views, and engagement can help diagnose delivery and creative resonance. They cannot prove profitable acquisition on their own.
The same caution applies to average account-level metrics. An average CPA can hide a small group of winning creatives subsidizing a large volume of waste. An average ROAS can conceal a retargeting campaign carrying weak prospecting. Break performance into meaningful segments, then compare each segment against its role in the funnel.
Do not overreact to every metric either. Small data sets, learning phases, seasonality, promotion periods, and tracking delays all affect interpretation. The answer is not less accountability. It is better context, clear thresholds, and enough data to distinguish a real pattern from normal volatility.
A useful report should make the next move obvious. If a metric cannot change a budget decision, creative brief, landing page test, or measurement plan, it belongs in the background. Keep the operating view focused on the signals that protect profit and create room to scale.